Gantt Chart: The Ultimate Guide (with Examples)
If you’ve been involved in a couple of projects, there is a high chance that you’ve come across the term Gantt chart. Most project managers swear by Gantt charts as one of the most intuitive ways of planning projects and visualizing their progress.
But what exactly is a Gantt chart? What is it used for?
In this guide, we’ll explain what Gantt charts are, what they are used for, and how to make them.
We’ll also take you through what Gantt chart software is and the key features to look for when choosing the right Gantt chart software for your needs.
What Is A Gantt Chart?
A Gantt chart is a chart made up of horizontal bars that are used to give a visual illustration of project tasks and their timelines.
In other words, a Gantt chart shows the tasks or activities that need to be completed, the start and end dates for each task, as well as the person responsible for each task.
Each horizontal bar in the chart represents a specific task, while the length of the bar corresponds to the length of time required to complete the task. Lines connecting one bar to another are used to identify and define dependencies between the tasks.
Gantt charts provide an easy way to keep your eye on the full picture of a project, monitor project progress, and keep track of project milestones.
Gantt Chart Example
If it’s your first time interacting with Gantt charts, they can look quite complicated. To make it easier for you to understand them, here is an example of a Gantt chart…
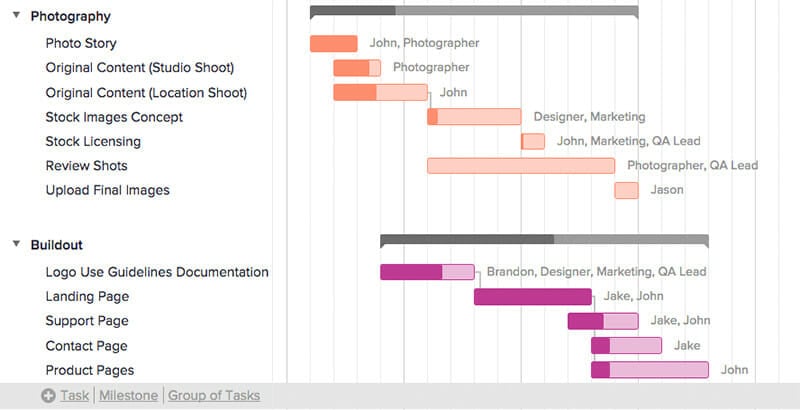
On the left side of the Gantt chart is a list of all the tasks that need to be completed. On the right side pane are the Gantt bars showing when the tasks start and end, as well as their duration.
For instance, you can tell that the ‘photo story’ task starts before the other tasks, while the studio shoot and the location shoot start at the same time. The longer the bar, the more time that specific task is expected to take.
The bars also show the percentage of the task that has been completed. For instance, you can tell that the ‘photo story’ task has been completed, while the ‘review shots’ task is yet to be started.
Finally, the bars also have names next to them showing the team members assigned to each task.
What Is Gantt Chart Software?
When they were first introduced by Henry Gantt in the early 1900s, Gantt charts used to be drawn on paper. With the advent of computers, Gantt chart software was designed to bring Gantt charts into the digital world.
Gantt chart software is a type of project management software that automates the process of building Gantt charts.
Gantt chart software allows you to build advanced Gantt charts that support functions like milestone tracking, task dependencies, calculating the critical path, auto-scheduling, and so on.
Gantt chart software also enhances collaboration on projects by allowing team members to communicate and share files.
With Gantt chart software, you can do all the following…
- Design visually appealing Gantt charts
- Assign tasks to team members
- Automatically pass work from one team member to another
- Estimate how long a project will take
- View the availability and workloads of your team members
In addition to building advanced Gantt charts, Gantt chart software also gives alerts and notifications on assigned tasks and approaching deadlines, thereby reducing the likelihood of missing deadlines.
There are two types of Gantt chart software – desktop Gantt chart software and online Gantt chart software.
Desktop Gantt chart software comes as an application that you have to install on your computer, and can only be used on your computer.
Online Gantt chart software, on the other hand, is cloud based, which means you can access your Gantt charts from any internet connected device from anywhere in the world.
What Is A Gantt Chart Used For In Project Management?
Gantt charts are widely popular in project management because of the multiple ways in which they can be used. Some of the things you can do using a Gantt chart include…
- Planning, scheduling and managing projects
- Presenting your project schedule in an easy to read visual format
- Breaking down the project tasks that need to be completed and managing these tasks
- Enabling team collaboration and ensuring all team members are on the same page
- Estimating the amount of time required to complete the project
- Tracking project progress
- Comparing actual project timelines against planned timelines
- Planning and managing sprints in projects that are executed using the agile framework
- Resource management, including assigning tasks to team members and managing your team’s workloads
- Keeping track of important project milestones
- Sharing files and documents related to the project
- Managing time in a more effective and more efficient manner
- Identifying your project critical path and identifying tasks that require the highest priority
- Identifying overlapping tasks and task dependencies
Top Gantt Chart Software Features
Most of the Gantt chart software in the market today are quite advanced and come with lots of bells and whistles, which can make choosing the right Gantt chart software a bit of a challenge.
While all sorts of extra features are nice-to-have, there are some key features that every Gantt chart software needs to have. Below are 8 of these key features…
1. Milestones
Milestones denote key dates or events within a project that mark the completion of a key project phase or a major deliverable.
A reliable Gantt chart software will allow you to set and keep track of project milestones. In most cases, the milestones are represented using a diamond shape.
2. Project And Task Progress
The core function of Gantt chart software is to help you visualize how your project is progressing. This means that Gantt chart software needs to have the capability to show project progress. In most cases, Gantt chart software uses different color shades to show completion percentage.
Aside from showing completion percentage, your Gantt chart software of choice should also allow you to compare actual progress against planned progress. This way, you can tell whether your project is moving within schedule or lagging behind.
3. Task Dependencies
In every project, there are tasks and activities whose completion relies on other tasks.
For instance, if you’re working on a project to create an online course, you have to choose a course topic before you start creating the course topic.
Similarly, you have to create the lesson content before you can start filming. Such relationships are referred to as task dependencies.
Always make sure that your Gantt chart software of choice allows you to show the dependencies between tasks. This way, both you and your team members will have a clear picture of how their tasks affect the completion of other tasks.
Aside from showing dependencies, a reliable Gantt chart software will also allow you to define the kind of dependency between the tasks. The different types of dependencies include start to start (SS), finish to start (FS), start to finish (SF), and finish to finish (FF).
4. Auto-Scheduling
Once a project is underway, things will not always go as planned. Some tasks might start late, others might take longer than you expected, and so on.
Since these tasks are related, changes in the starting and completion dates of one task will definitely have an effect on the other tasks.
Instead of having to manually make adjustments to various project dates, a reliable Gantt chart software provides auto-scheduling capabilities.
This way, when you make changes to the start and completion dates of one task, the software automatically makes adjustments to the other dates to reflect the changes.
5. Critical Path
In project management, the term critical path refers to the longest sequence of tasks and activities that have to be completed in order for the project to be delivered successfully.
With a good Gantt chart tool, you can easily calculate and visualize the critical path for your project. This, in turn, makes it easier to identify the tasks that need to be prioritized, and to calculate the minimum amount of time you need to complete the project.
6. Collaboration Features
While different team members are assigned to different tasks, they often need to work together and collaborate in order for everyone to successfully deliver their tasks.
When choosing a Gantt chart software, go for one that provides features that make it easy for team members to collaborate on tasks.
Look out for collaboration features like commenting on tasks, chat, real-time alerts and notifications, team member tagging, file sharing and so on.
7. Export Option
Sometimes, you might want to share project timelines with people who are not directly involved in the project, such as clients and other stakeholders.
In such situations, it is highly beneficial to have Gantt chart software that allows you to export your Gantt charts as images or PDF files.
8. Third Party Integrations
Most businesses already use a handful of software tools and applications to automate various business aspects. When choosing a Gantt chart software, you should ensure that it supports integration with such third party tools that you routinely use in your business.
An effective Gantt chart software will allow integration with common marketing automation tools, email marketing tools, CRM tools, document management tools, workflow management tools, and other popular business tools.
How To Make A Gantt Chart
On the face of it, Gantt charts look complex and complicated, but they are actually very easy to make. Below, let’s look at two different ways of making a Gantt chart.
How To Make A Gantt Chart Online
- Gather all the information you need to create your Gantt chart. This includes information about all projects tasks, and the resources available for the project.
- Choose your preferred online Gantt chart maker, such as Monday.com or ClickUp.
- Pick your preferred Gantt chart template. Most online Gantt chart makers will have a couple of templates to choose from.
- Customize the template by adding the tasks you listed in step one to the Gantt chart.
- Enter the start and completion dates for each task.
- Define any dependencies between tasks.
- Set the milestones that you’ll use to track project progress.
- Assign the project tasks to the available team members.
- Find the critical path for your project.
Creating a Gantt chart online is that simple. Once you’re done with the above steps, you can now share a link to the Gantt chart with your team members and other project stakeholders and start using it to monitor and track project progress.
How To Make A Gantt Chart In Excel
Creating a Gantt chart in Microsoft Excel is a bit more complicated compared to creating one online, since Excel doesn’t come with an inbuilt Gantt chart template.
It’s also good to note that your Excel Gantt chart will not be responsive, and you’ll have to share the newer version of the Gantt chart with your team members and stakeholders whenever you make changes to your Gantt chart.
If you still prefer using Excel, however, here are the steps to follow…
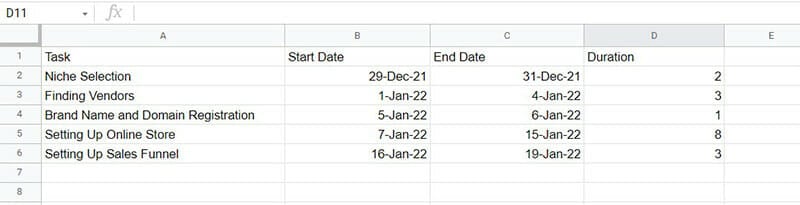
- Create an Excel file and fill in your project tasks, with different columns for start date, end date, and duration.
- Select the data range on the “Start Date” column, then go to insert and select “stacked bar.”

- To add duration data to your graph, right click on the graph and click on “Select Data.”
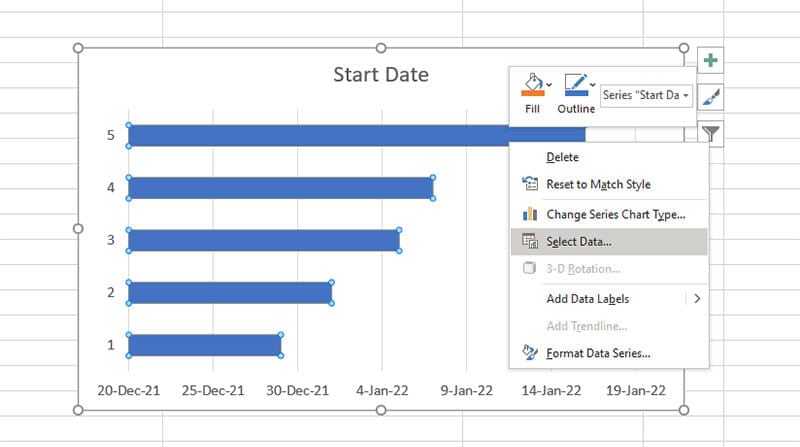
- Click on “Add” to add a new data range to your graph
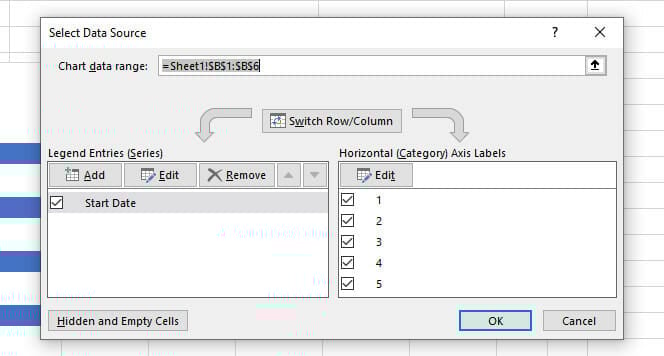
- In the new box that pops up, choose a name for the new data range (in our case, the name is Duration), and then move down to Series value and click on the range selection icon to choose your data range.

- Select the data in the Duration column to add it to the graph, then hit the icon at the right of the range selection box to close to minimize the box.

- Click On “Okay” to add the new data range to your chart. The chart will now look like the image below.
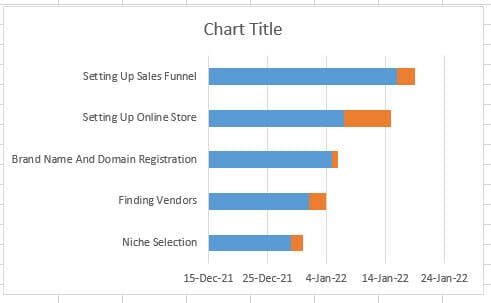
- To transform your chart into a Gantt chart, the next thing you need to do is to make the blue bars invisible. To do this, right click on the blue bar, and click on “Format Data Series.”

- In the new pane that pops up to your right, select “Fill and Line,” and then click on “No Fill” and “No Line.” Next click on “Series Options” and adjust the “Gap Width” to zero. Your chart will now look like this…
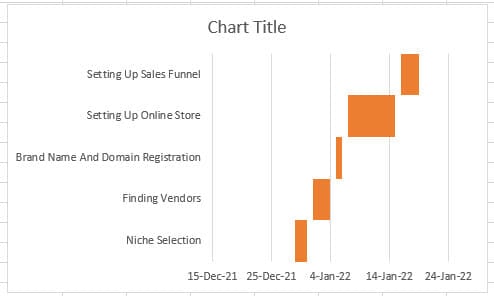
- You now have a Gantt chart, but at this point, it is in reverse order. To correct this, right click on the list of tasks and click on “Format Axis.”

- In the “Format Axis” dialog pane on the right of your screen, click on the “Categories in reverse order” checkbox. Your Gantt chart will now look like this…

That’s it. If you correctly follow the above steps, you’ll have created a simple Gantt chart using Excel. If the process seems too long and complicated, however, you can build Gantt charts faster by using a Gantt chart template for Excel.
Gantt Chart Templates For Project Managers
It is possible to build your own Gantt charts from scratch. However, this can be a bit complicated, depending on the Gantt chart maker you’re using.
For instance, with Excel, the process of building a Gantt chart from scratch is quite lengthy. An easier way to quickly build beautiful Gantt charts is to use a Gantt chart template.
There are tons of Gantt chart templates available on the internet. However, most of these Gantt chart templates are designed for specific Gantt chart makers.
For instance, an Excel Gantt chart template can only be used on Microsoft Excel, while an Instagantt template can only be used on Instagantt.
Below are links to some Gantt chart templates that you can use on specific platforms…
- Office Timeline Gantt chart templates
- Simple Microsoft Excel Gantt chart template
- Aha.io Gantt chart templates
- Free Instagantt Gantt chart templates
- Simple ClickUp Gantt chart template
Gantt Chart FAQ
Gantt charts can be used by anyone looking for an effective way to plan, schedule and manage a project.
You can use Gantt charts for all kinds of projects, from small personal projects, to large projects that involve multiple teams. Some of the types of projects where you can use a Gantt chart include…
– Product development projects
– Marketing campaigns
– Engineering process revamp
– Website design projects
– Construction projects
– Event planning projects
– Manufacturing projects
Using a Gantt chart in project management offers several benefits. Some of these include…
Gantt charts give you a bird’s eye view of your project. With a single glance, you can tell how a project is going, and whether you’re on schedule to hit each milestone.
With Gantt charts, it’s a lot easier to identify the relationships between project tasks and each task affects the others. This can help you identify potential conflicts and fix them early on.
Better resource management. With a Gantt chart, you can see who is assigned to what, which makes it easier to identify team members who are overloaded with work, and those being underutilized.
Gantt charts allow everyone within the team to track project progress, view the work assigned to other team members, and how this work is coming along. This leads to better accountability and transparency.
Best Gantt Chart Builders To Try
Gantt charts are an easy and effective way to plan your project and monitor project progress. They make your team more productive, improve transparency and accountability, and allow you to identify and fix potential issues before they derail your project.
If you are looking for a great Gantt chart maker, here is a list of the best Gantt chart builders to try.
- Monday.com: The best overall Gantt chart builder that offers high quality visualizations.
- ClickUp: Best solution for those looking for an affordable Gantt chart builder.
- Wrike: A simple and user-friendly Gantt chart tool that’s great for those looking to manage multiple projects simultaneously.
- Teamwork: Powerful Gantt chart tool that offers great collaboration features.
Was This Article Helpful?
Anastasia Belyh
Anastasia has been a professional blogger and researcher since 2014. She loves to perform in-depth software reviews to help software buyers make informed decisions when choosing project management software, CRM tools, website builders, and everything around growing a startup business.
Anastasia worked in management consulting and tech startups, so she has lots of experience in helping professionals choosing the right business software.