Data Analytics Statistics. The Whole Industry at Glance – 2025
In 2023, data analytics statistics will be even more important than today. Companies will increasingly rely on data to decide their products, marketing, and operations.
The use of data analytics will become more common in businesses of all sizes, as they strive to understand their customers better and make more data-driven decisions. We will also see an increase in the use of artificial intelligence and machine learning to automate tasks and make predictions.
In this article, we present some new data analytics facts and trends, as well as modern technologies like data visualization tools and CRM software that can help you to utilize your data more productively. Here’s a peek at the latest data analytics stats and trends to watch out for in 2023:
Key Data Analytics Statistics for 2023
- The global market for data analytics is expected to be worth over $100 billion in 2023.
- The median salary for a data analyst in 2016 was $63,000, but by 2026 it is expected to reach $85,000.
- AI will be used in 40% of data analytics projects in 2023.
- The number of data analytics startups has increased by 50% since 2016.
- 2/3 of business managers rely on their intuition over data when making business decisions.
General Data Analytics Statistics
1. Data analytics accelerates decision-making by five times for organizations.
(Business Wire)
Data analytics is crucial for making rapid decisions in today's competitive environment. Businesses can develop models to predict future results by evaluating historical data.
As a result, they can leverage actionable insights and make informed decisions five times faster. Businesses can also utilize data analytics to spot trends and opportunities that would otherwise go unnoticed.
According to 63% of businesses surveyed by Business Wire, data analytics helped increase productivity, and 57% said it helped increase decision-making effectiveness.
2. In 2022, the US had a shortage of 250,000 people with data analysis skills.
(CIO)
This figure is based on the expected 1.5 million jobs in the US that’ll need these skills. As businesses depend more and more on data to make wise decisions, there’ll be a rising need for people with these abilities.

3. The demand for data scientists is predicted to grow by 50% annually.
(Cisco)
The need for data science experts has skyrocketed recently. That‘s partly because big data/BI is developing, and there is a demand for experts who can handle and analyze enormous data points.
Data experts with knowledge of statistical analysis and business analytics, as well as the ability to create and maintain big data analytics systems, are in very high demand by businesses.
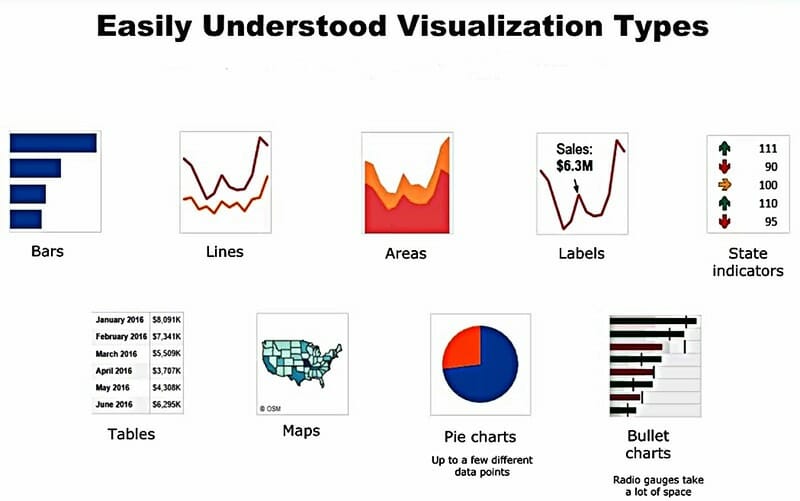
4. 70% of firms consider data visualization to be crucial.
(DOMO)
According to a report by DOMO, it’s taken very seriously by 3/4 of business owners. That’s because infographics, graphs, charts, and maps help demystify complex data.
Data visualization makes it easy to discover customer data correlations, trends, patterns, and other information critical for decision-making.
5. 2/3 of business executives rely on their intuition over data when making business decisions.
(Accenture)
As it turns out, companies using business intelligence solutions have discovered some significant issues with business analytics. Firstly, about half of all employees say they would rather rely on instinct than follow statistics when making decisions.
Secondly, the majority of people dislike the data analysis process. For instance, if given a task that involves processing data in some sought, a third of employees would attempt to wiggle out of it and do the job without using a business intelligence software.
At the same time, 14% would refuse to complete the task at all. In other words, data analytics stats demonstrate that it’s ineffective to merely give data processing amateurs fancy software applications.
6. 24% of business executives say their businesses are data-driven.
(NVP)
This was the conclusion of a survey conducted in 2022. In a study conducted in 2021, the same question was asked, and 37.8% of CEOs stated that they ran data-driven organizations.
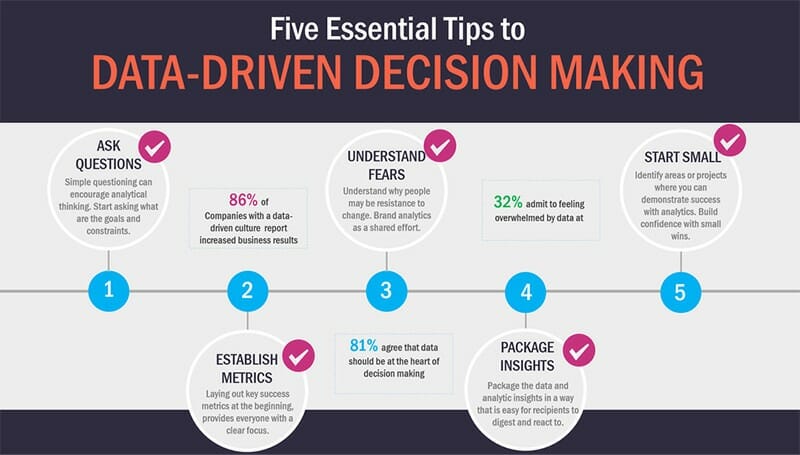
According to 92.2% of business leaders, incorporating data-driven decision-making into company cultures has proven difficult for their organizations, which is why many experts blame this decline on those futile attempts.
7. Poor data quality costs the US economy $3.1 trillion annually.
(Fortune Business Insights)
Employees will squander valuable time trying to fix and organize poor-quality data instead of working on more productive tasks. It happens when the data a corporation requires to run its business needs to be completed, updated, or corrected.
Not to mention that poor marketing business information might cause B2C businesses to make terrible mistakes and cause public shame.
When video game publisher EA distributed brass knuckles as a promotional gift to gamers, it was later discovered that they are prohibited in half of the nation. As a result, the firm was forced to recall all packages. And yep – it cost them big time.
8. More than 180 zettabytes of data will have been generated worldwide by 2025.
(Statista)
That much data is being produced, copied, and stored online! According to data science statistics, the total data produced globally will reach 64.2 zettabytes in 2023.
The amount of data created and replicated hit a record high at the peak of the digital transformation in 2020, increasing by 23.2 zettabytes in this year. The pandemic raised demand since more people started working and studying from home.
Scientists predict that approximately 200 zettabytes of data will require more storage capacity. As a result, the advanced analytics and repository segment will grow by 19.2% annually between 2020 and 2025.
9. From 2010 to 2020, data interactions increased by 5000%.
(Forbes)
According to data science stats, between 2010 and 2020, there was a stunning increase in data creation, copying, capturing, and consumption. To be more precise, the amount of data used rose from 1.2 trillion gigabytes to nearly 60 trillion.
The dramatic increase resulted from more businesses implementing work-from-home policies. The change was brought about by the demand for more videos during virtual meetings.
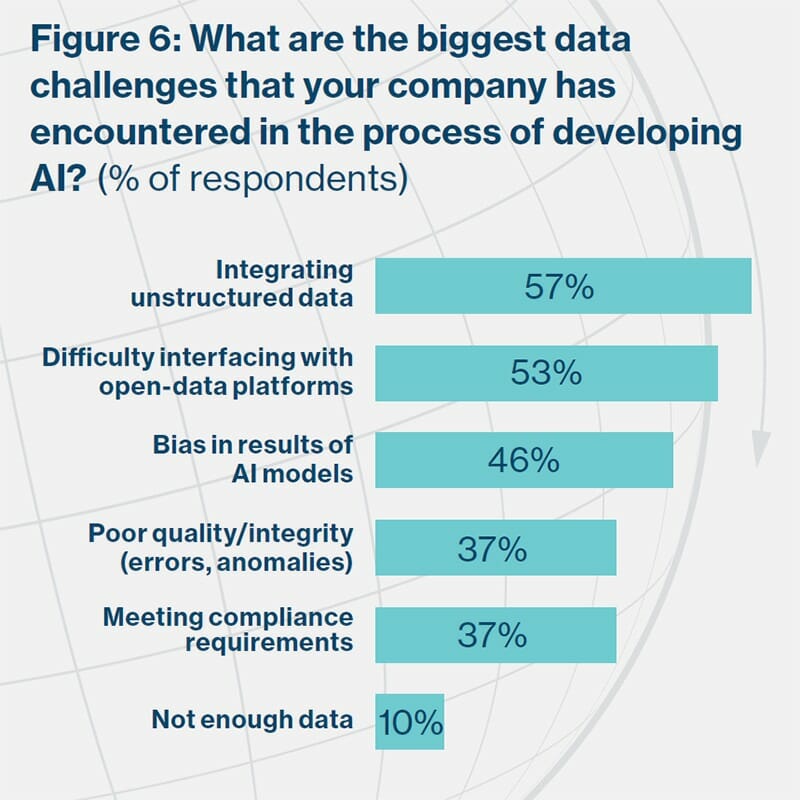
10. More than 57% of businesses believe their main issue is intergrating unstructured data.
(GlobeNewswire)
The percentage of unstructured data created today is around 80%. Customers can contact a brand via social media, email, live chat, or phone. Although all this data comes from a single source, it takes several diverse forms.
That's a significant amount of customer data from a single source. However, it’s these data insights that businesses must use to understand and improve their customer acquisition strategy.
These organizations can use predictive analytics or other steps involved in the data analysis pipeline to estimate the future and evaluate current market patterns to make future predictions. However, only 3% of businesses have been fully able to act on the knowledge obtained.
11. 45% of businesses worldwide operate a sizable data workload in the cloud.
(GlobeNewswire)
The most recent technology that is gaining popularity worldwide is cloud computing. Businesses are not required to buy and maintain expensive computer hardware. Instead, they can spend money on the best cloud web hosting services and use them to manage everyday tasks.
94% of businesses store their data on a cloud server, and 30% of IT budgets also go toward it.Additionally, many more companies currently use their cloud for various advanced analytics processes.
12. By 2024, there’ll be 1:10 unique to replicated data.
(IDC)
In 2020, that ratio was 1:9. The world’s data industry will expand through copying and consumption in the upcoming years. It’ll grow at a 26% compound annual growth rate till 2024.
13. The average small business doesn’t use between 60 and 73% of its data for analytics.
(Oracle)
This indicates that roughly 75% of business data that needs to be examined is wasted instead. This statistic shows that it’s useless for firms to gather data and then decide not to use it to generate insights or deliver real-time results.
14. By 2030, there’ll be a 31% increase in the need for composite data analytics professionals.
(Forbes)
Additionally, according to the most recent statistics, about 90% of businesses are beginning to recognize the importance of data mining and analytics. That’s a significant improvement from ten years ago, when organizations only examined 0.5% of data.
So, according to US Bureau of Labor forecasts, growth will be 31% by 2030. 60% of firms will adopt composable and predictive analytics due to its potential to reduce the capital that companies spend.
Big Data Statistics
15. $274 billion is the value of the global big data and analytics market.
(SiliconANGLE, Wikibon)
Big data statistics show that the industry has experienced phenomenal growth in a short period. It soared by 62%, from $169 billion in 2018 to $274 billion in 2022. By 2027, the big data analytics market is anticipated to create $103 billion in revenue.
The rise in big data spending is driven by the ongoing development of mobile data, cloud computing, machine learning, and IoT. By 2027, big data revenue is anticipated to double what it was in 2019.

16. Since 2019, investments in big data cost reduction and regulations have quadrupled.
(NewVantage Partners)
Most of a company's big data budget is spent on innovation and digital transformation, but “defensive” investments like cost control and compliance are taking up more and more of the budget each year.
Defensive concerns influenced only 8.3% of investment decisions in 2019 and accounted for 35.7% of big data investments in 2022.
17. Business managers report that 27% of their big data initiatives have paid off.
(Capgemini)
Global tech consultancy company Capgemini surveyed 210 executives—half from the US and the other half from Europe—to learn more about their attitudes toward their big data initiatives.
45% of companies said they “break even” on Big Data, while just over a quarter reported profitability. Only 12% of big data ventures reported financial losses.
18. Facebook produces 4 petabytes of data per day.
(Kinsta)
That amount translates to one million gigabytes. All that information is kept in the Hive, a massive 300-petabyte storage system.
Because Facebook has 2.8 billion monthly active users who spend an average of 10 minutes and 18 seconds per visit, an enormous amount of content is being produced.
19. The US has a market share of 51% in big data analytics solutions.
(IDC)
The US is far ahead of all other nations spending on big data. In 2021, American-owned businesses spent $110 billion. The next two biggest markets, Japan and China, spent $12.4 billion and $11.9 billion, respectively.
20. Budget restrictions are the primary obstacles businesses encounter when utilizing Big Data.
(Capgemini)
Budget restrictions were cited by 35% of US executives as the main obstacle to converting Big Data into a successful corporate asset.
Lack of quality data, fragmented systems, data security issues, integration difficulties, a lack of technological know-how, and the growth of data silos rounded out the top hurdles.

21. There’ll be 41.6 billion IoT-connected devices worldwide by 2025.
(Dell Technologies)
According to big data industry statistics and predictions by The International Data Corporation, the Internet of Things (IoT) devices will produce 79.4 zettabytes of data.

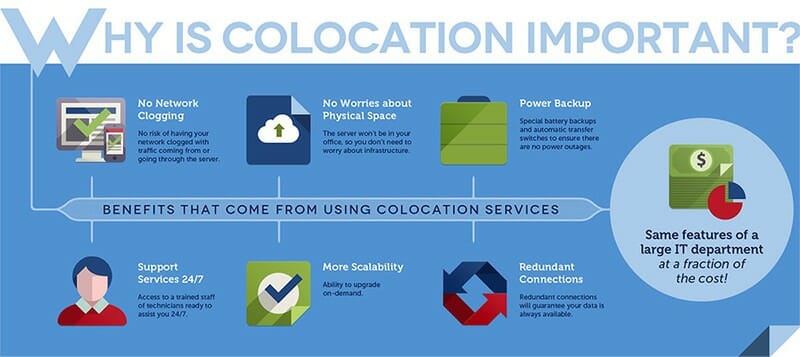
22. Each year, colocation data centers bring approximately $31.39 billion in revenue.
(Statista)
The market for third-party data storage is expanding, as colocation data centers offer a cost-effective way for small businesses to stay competitive in the big data analytics space. While the industry for data centers is currently worth over $30 billion, by 2025, it is expected to reach $58.28 billion.
23. The US has approximately twice as many data centers compared to the UK, Germany, and China combined.
(Cloudscene)
Big Data would not be possible without data centers to store and transport data from all over the world. Just in the US, there are 2,751 data centers. They provide essential managed, cloud, and colocation services.
24. 43% of IT decision-makers worry that their IT infrastructure won't be able to handle increasing data needs in the future.
(Dell Technologies)
Both humans and machines are producing exponentially more data.
To manage their data in the future, enterprise companies will need to use several technologies, including edge computing, 5G, and machine learning, according to big data and analytics statistics from Dell Technologies.
The number of monthly searches for “5G” has increased by over 2,400% from 5 years ago.
25. 97.2% of businesses are actively investing in big data and AI.
(New Vantage)
Big data and AI were the two main topics of New Vantage's Executives Survey. About 60 executives from Fortune 1000 organizations, including Motorola, American Express, NASDAQ, etc., responded to the survey.
The New Vantage study responded to how much money businesses spent on data analytics and showed a significant presence of big data in leading companies. So, here is what they discovered.
63% of businesses invested less than $50 million. 27% reported that their organizations had spent between $50 million and $550 million on big data and AI. Finally, just 12.7% of participants said that their businesses had invested more than $500 million.
26. According to O'Reilly, the average income for data and AI experts is $146,000.
(Cloudscene)
Despite the allure of six figures offered by big data jobs, salary growth has stagnated at just 2.25% annually. Data and AI professionals' purchasing power decreases considering the 7% inflation rate for 2022.

27. Recommendations algorithms save Netflix $1 billion annually.
(Inside Big Data, Statista)
Today, many firms use big data to develop and improve their operations. Netflix, one of the most well-known video streaming services, is a prime example of this.
In 2020, Netflix, the preferred streaming service among online users, had more than 180 million customers.Subscription cancellation rates are lower and customer retention is achieved by leveraging big data.
Netflix gathers data about its users' searches, ratings, repeat viewings of shows, and other activities. Using this information, Netflix can show its customers videos similar to ones they've already watched or recommend various titles in a particular genre.
Additionally, we must acknowledge that the company's “Continue Watching” option dramatically enhances the user experience.
We learned from looking at various big data statistics that Netflix spent $1 million improving its recommendation algorithm back in 2009.The company launched a competition where software developers were to come up with a recommendation system that was better than the inhouse one and win a million bucks.
Even more intriguing is the $651 million budget the business set aside for research and development in 2015. The budget increased to $1.3 billion in 2018.
Regarding the $1 billion in savings through client retention, Carlos Uribe-Gomez and Neil Hunt only provided an approximate estimate in 2016. Because Netflix spent more than $12 billion on content in 2018, which increased to $17 billion in 2020, we think the number is substantially greater.
Data Analytics Industry Trends
28. Though AI will advance, humans will still be essential.
(Gartner)
According to a Gartner report, AI will make interpretable systems and better learning algorithms. Businesses will start to demand a lot more from AI systems and need to figure out how to scale the technology, which has been difficult so far.
While AI is likely to advance more, we have yet to reach the stage where it can perform tasks as well as humans. Organizations will still want data analytics tools to enable their personnel to identify threats and anomalies quickly.
29. Analytics tools that are native to the cloud will be required.
(Gartner)
Companies looking to maximize business intelligence will switch to cloud-native data solutions as legacy analytics options continue to lag constantly evolving cloud-native solutions.
Suppose businesses wish to achieve a competitive edge through analytics and BI. In that case, Gartner advises that they “include innovative cloud analytics tools in their portfolio, renovating components or augmenting existing on-premises infrastructure.”
Given that most suppliers don't concentrate their R&D efforts on legacy systems, completely ignoring cloud analytics options poses a risk to many enterprises.
30. BI will depend even more on self-service analytics.
(Dresner Advisory Services)
Companies are looking for self-service data analytics solutions due to the need for more fact-based everyday decision-making.
Jim Ericson, research director at Dresner Advisory Services, has recently noted that self-service BI capabilities are more likely to be used by organizations that are more successful with BI.
31. Thanks to changing market trends and BI, data visualization has quickly dominated the market.
(NewVantage Partners)
Data visualization is the final step in analytics and helps businesses understand vast amounts of complex data. Businesses now find it simpler to make decisions by utilizing visually engaging methods thanks to data visualization.
By enabling data to be seen and presented in the form of patterns, charts, graphs, etc., it has an impact on the analytical methodology used by specific industries. It’s a great way to forecast future trends for the company because the human brain interprets and remembers visuals better than text.
32. Data Fabric will be widely used as a re-architect solution or IaaS (Infrastructure as a Service) by 2026.
(PWC)
Across hybrid and multi-cloud environments, a data fabric is a robust architectural framework and collection of data services that standardize data management procedures and uniform capabilities.
IaaS has become a current trend in organizations, and many businesses will rely on it in the future, as it contains various integration styles, data hub skills and technologies. This adoption will come as a response to increasing data complexity.
Additionally, it lowers system complexity by reducing design (30%), deployment (30%), and maintenance (70%).
33. Because of the widespread use of data science and AI, XOps has become essential to business transformation processes.
(Finance Online)
By combining development and operations, or DevOps, XOps was founded to enhance business operations, customer experiences, and operational efficiency. It aims to prevent technology and process duplication and to increase repeatability, reusability, and reliability.
Overall, XOps' main goal is to help organizations achieve economies of scale by providing flexible design and agile orchestration in collaboration with other software disciplines.
34. There’ll be increased use of Augmented Analytics in 2023.
(Think With Google)
To automate and improve data analytics, data sharing, business intelligence, and insight discovery, this data analytics concept uses Natural Language Processing, Machine Learning, and Artificial Intelligence.
Augmented Analytics is now performing the duties of a Data Scientist, from assisting with data preparation to automating and processing data and gaining insights from it.
With the aid of augmented analytics, data inside and outside the company can also be combined, which facilitates business processes much more quickly.
35. No more predefined dashboards will be needed.
(Think With Google)
In the past, organizations were limited to static dashboards with predefined data, and manual data exploration was only available to citizen data scientists or analysts. Due to their lack of interaction and user usability, dashboards have outlived their usefulness.
Dashboards' usefulness and return on investment (ROI) are being questioned, prompting businesses to look for solutions that will let them independently explore data and save money on maintenance.
Modern automated data mining and BI tools that present insights tailored to a user's needs appear to be gradually replacing predefined dashboards.
Data Analytics FAQ
According to data analytics statistics, there are four main categories: Predictive, prescriptive, diagnostic, and descriptive data analytics.
– Businesses utilize predictive data analytics to find trends, causes, and connections.
– Big Data and AI are integrated into prescriptive data analytics to make predictions and determine the best action.
– Analyzing data to identify causes and events is known as diagnostic data analytics.
– With descriptive data analytics, business intelligence tools and dashboards can be used.
Statistics focus on gathering, processing, interpreting, and presenting data, while the goal of analytics is to use statistical techniques to solve real-world business issues.
Data analytics has advantages for both people and organizations. Data analysts often examine unprocessed data to find fresh trends and insights.
Different strategies and instruments are used by data analytics to help businesses prosper and make choices more quickly.
According to Zippia, 2.5 quintillion bytes of data are produced by internet users daily. That's the total amount of data generated globally by all people using the internet to search, post, and communicate.
According to estimates, each person generates 1.7 MB of data every second. Remember that even if this is the global average, those of us who regularly stream movies and music produce far more data than the 40% of the world's population who don't even have access to the Internet.
According to Zippia, Americans use 3.14 gigabytes of internet data every minute in the US, whether for sending or reading text or email messages, streaming and video content checking the weather, or posting to or browsing through social media.
The market for big data and business analytics was estimated to be worth 169 billion dollars worldwide in 2018 and is projected to reach $274 billion worldwide in 2023.
The total amount of data on the internet exceeds 64.2 zettabytes. This number was the total as of 2022, and it's still rising.
More than 180 zettabytes of data will have been produced, used, and stored globally via the internet by the year 2025, according to researchers. For comparison, one zettabyte is equivalent to one trillion gigabytes or one sextillion bytes.
Grow Your Business With Data Analytics
The abovementioned stats show that businesses confront the massive difficulty of filtering through all the different data sets to derive insightful conclusions and guide business decisions.
It’s, therefore, crucial to use data visualization tools to help you and your team make sense of it all.
- Tableau can help you to easily store, process, transform, and visualize your data. The tool is best suited for businesses with data analysts or BI professionals.
- Infogram is a fully-fledged data visualization tool – perfect for non-designers and designers. The tool has premade templates that will make all your presentations look professional on any device.
- ChartBlocks is a cloud-based chart-building software that allows you to customize charts and synchronize them with any data source. The tool starts at $0 per month, which means there is zero risk in trying it out.
Sources
- Business Wire
- CIO
- Dell Technologies
- Fortune Business Insights
- GlobeNewswire
- Internet Live Stats
- Forbes
- Kinsta
- Market Data Forecast
- Statista
- Master’s in Data Science
- MichiganTech
- Mordor Intelligence
- Statista
- Oracle
- Statista
- Statista
- The Economic Times
- ZDNet
- Global Web Index
- The Economic Times
- Statista
- Wikibon
Was This Article Helpful?
Martin Luenendonk
Martin loves entrepreneurship and has helped dozens of entrepreneurs by validating the business idea, finding scalable customer acquisition channels, and building a data-driven organization. During his time working in investment banking, tech startups, and industry-leading companies he gained extensive knowledge in using different software tools to optimize business processes.
This insights and his love for researching SaaS products enables him to provide in-depth, fact-based software reviews to enable software buyers make better decisions.